2008 COMPONENT SURVEY OF BUSINESS CONDITIONS
Business Conditions in All Regions of the Country Weakened in 2008; Demand for Architects Also Slowed
by Jennifer Riskus
Economics and Research Manager
Summary: Business conditions weakened substantially in 2008 in virtually all AIA regions, according to component leaders and executives. Two-thirds of the AIA regions indicated that current business conditions are “so-so” or worse, and many regions reported that conditions are much worse this year than in 2008. The demand for architects has also declined in this economic slowdown, and although experienced architects remain in highest demand, the degree of need has lessened. Business conditions have also weakened in all building sectors, with component leaders reporting that the residential sector is the weakest, followed by commercial/industrial and institutional.
In the AIA’s annual survey of component leaders, respondents indicated that business conditions across the country have weakened dramatically in 2008. Component leaders rated business conditions in the area served by their components an average of 5.2 (using a scale of 1 to 10, with 1 being “terrible” and 10 being “couldn’t be better”). One third of the 18 component regions of the country rated business conditions in their region below a 5, with the industrial Midwest reporting some of the weakest conditions, led by the Illinois and Michigan regions with the two lowest scores (2.0 and 2.8 respectively). California, the Florida/Caribbean region, and several of the regions in the Northeast also reported fairly weak conditions. The agricultural Midwest, South, and parts of the mid-Atlantic reported the highest scores, led by the Pennsylvania (7.1), Texas (7.0), and Central States (6.2) regions. (Place your mouse over any region on the map to see its responses.)
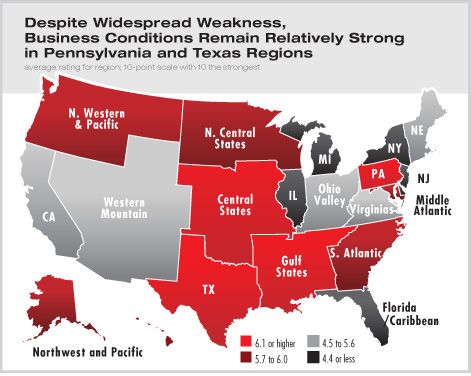
 
 When asked to compare business conditions in their component area this year compared to last year, component leaders rated them an average of 4.0 (on a scale of 1 to 10, with 1 being “much worse” and 10 being “much better”), which indicates how much further business conditions at architecture firms across the country have fallen in 2008. In fact, with the exception of the Pennsylvania, Texas, and South Atlantic regions, component leaders in all regions rated this year compared to last below a score of 5.0. The hardest hit regions have been New Jersey and Florida/Caribbean; both rated this year compared to last year as just a 2.5. Respondents in the New York and Western Mountain regions also indicate that conditions have deteriorated rapidly over the last 12 months. When asked to compare business conditions in their component area this year compared to last year, component leaders rated them an average of 4.0 (on a scale of 1 to 10, with 1 being “much worse” and 10 being “much better”), which indicates how much further business conditions at architecture firms across the country have fallen in 2008. In fact, with the exception of the Pennsylvania, Texas, and South Atlantic regions, component leaders in all regions rated this year compared to last below a score of 5.0. The hardest hit regions have been New Jersey and Florida/Caribbean; both rated this year compared to last year as just a 2.5. Respondents in the New York and Western Mountain regions also indicate that conditions have deteriorated rapidly over the last 12 months.
Moderately experienced architects in greatest demand
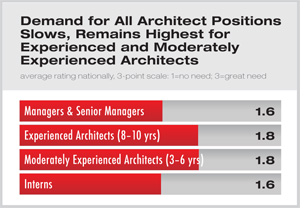
Component leaders report that the overall demand for architects of all experience levels declined dramatically in 2008. Experienced architects with 8-10 years of experience and moderately experienced architects with 3-6 years of experience remained the positions in highest demand, but the degree of need for each was rated as just 1.8 (on a scale of 1 to 3, with 1 being no need and 3 being great need). The demand for managerial architects (managers/senior managers) and entry-levels interns received even lower ratings, with both at 1.6.
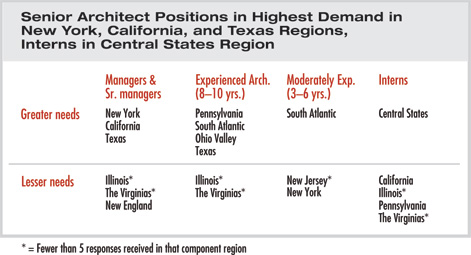
Survey respondents indicated that architects with management experience are in highest demand in the more populous areas of the country (e.g. the New York, California, and Texas regions), while interns are needed in the Central States region. Firms located in the South Atlantic region, as well as those in the Texas region, have the highest demand for architects, while firms in the Illinois and The Virginias regions have little need for additional staff.
 Institutional sector the strongest, but beginning to ease Institutional sector the strongest, but beginning to ease
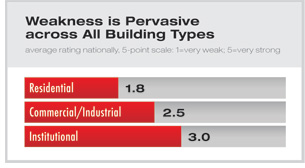
In contrast to last year, where both the commercial/industrial and institutional sectors received scores indicative of strong business conditions, in 2008 component leaders did not rate any sector above a 3.0 (on a scale of 1 to 5, with 1 being “very weak” and 5 being “very strong”). In fact, the residential sector was rated weakest by the survey respondents, while the commercial/industrial sector was perceived to be in between weak and moderate. Business conditions in the institutional sector fared the best, although they were just rated as moderate by the survey respondents.
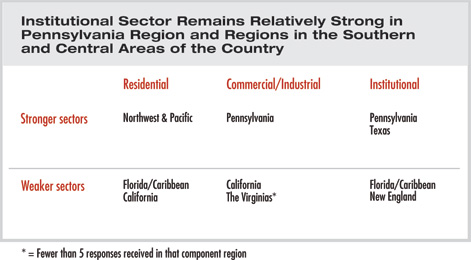
Weakness in the three major construction sectors is widespread across the country, but the California and Florida/Caribbean regions have been particularly hard hit, reporting significant weakness in both the commercial/industrial and institutional sectors. On the other hand, component leaders in the Pennsylvania region say their commercial/industrial and institutional sectors remain strong. Respondents from the Texas region also indicated strength in the institutional sector, while the Northwest & Pacific was the only region in which multiple component leaders reported that conditions in the residential sector were strong.
|