
| BIMStorm Hits LA
The grassroots exercise was organized by Kimon Onuma, FAIA, founder and president of Onuma, Inc., in Pasadena, Calif., as a proof-of-concept demonstration of the Onuma Planning System (OPS), an online collaboration tool created by Onuma and first described in this column in August 2007.
BIMStorm LAX was an exercise to push the OPS technology to its limits. While an urban design charrette typically would be organized in response to the urban development requirements of an urban planning agency, anyone and everyone who wished to participate in the BIMStorm was welcome to do so, each bringing his or her own planning and design objectives to the process. Remarkably, even without the constraints of defined objectives, the BIMStorm participants were able to collaborate and cooperate in a way that yielded meaningful results. In response to an e-mail inquiry from Mario Guttman, AIA, of HOK, one of seven reviewers who will be evaluating the results of BIMStorm LAX over the next month, Kimon Onuma replied: “For all of the participants (including the Onuma team) much of this was a first time experience. Some had never used the [OPS] tools until a few hours before starting, others [had been] practicing for awhile. There was some confusion and chaos, but it was an organized chaos since we used open, interoperable standards.” “Lessons learned from communication were very interesting and what we expected,” Onuma added. “We tried to minimize or eliminate completely the need to communicate by traditional methods—e-mail, voice, or documents—and focused on communicating with data. For example, a team in California submits a building into OPS, it gets downloaded [in IFC format] in Honolulu, where they design the structural system and submit it back. A team in Manila continues with the structural design, a team in the Netherlands picks up the building and designs the mechanical system, a team in the U.K. runs the same building through Ecotect for energy analysis. Most of these teams did not communicate at all other than through the IFC model, or did not even know the other team existed. They just had to log on and view the reality of what was being developed and run with it.”
OPS—built on open standards—allows participants in a planning and design process to use whatever tool they choose to complete a particular task. Participants might not even know which tools other participants are using. The tools used for BIMStorm LAX included paper-and-pencil overlays for early concept planning and design; ArchiCAD by Graphisoft, Revit Architecture by Autodesk, and VectorWorks by Nemetschek North America for building design; Ecotect by Square One Research for energy analysis; Elite CAD by Elite Software for HVAC systems design; MARS Facility Cost Forecast System by Whitestone Research for operations and maintenance cost forecasting; Google Earth for “landing” buildings on a virtual representation of LA; and, of course, OPS for generating a variety of data and graphical reports, including spatial data summaries and construction cost estimates. Taking planning to the next level
“We need to take our planning to the next level, have it more accessible, dynamic, exciting, at more convenient times [for public participation]. It’s hard getting people to attend meetings regularly. If we had a tool where they could interact dynamically, then they could comment more conveniently—from home, from a community center, or from a church—in a way that would give them their own process. They could participate in testing ‘what if’ scenarios. “So much time is spent in the master planning process visually depicting information we have for all stakeholders. Because of the graphic nature of it, you can only do certain things on certain maps: you have a transportation map, a circulation map, a stream map, an impervious surface map; but you can’t display them in any interactive way. The potential of [an interactive online tool such as OPS] is that you could do that. [Watching the BIMStorm], you could sense its potential as a dynamic planning application.” |
||
Copyright 2008 The American Institute of Architects. All rights reserved. Home Page |
||
news headlines
practice
business
design
Michael Tardif, Assoc. AIA, CSI, Hon. SDA is a writer and editor in Bethesda, Md., and the former director of the AIA Center for Technology and Practice Management.
Captions:
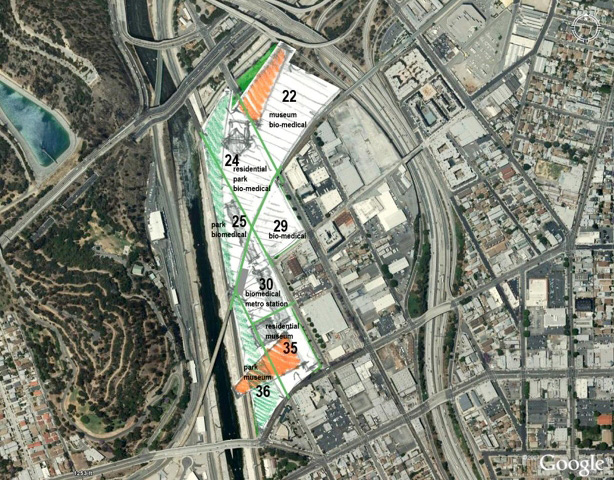
Freehand planning/design sketch of the Cornfields Planning Area of Los Angeles overlaid on the actual site in Google Earth. Sketch by DeStafano and Partners Ltd., Chicago and Los Angeles.
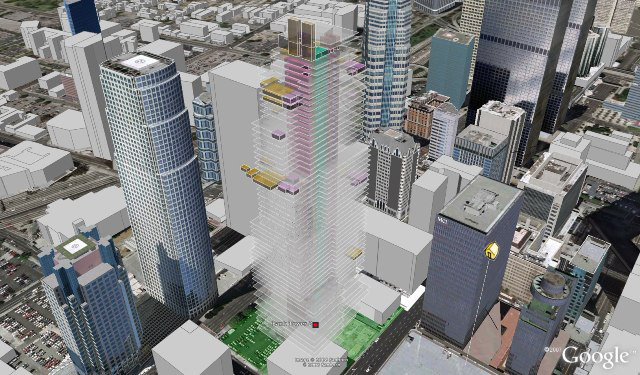
Birdseye view of downtown Los Angeles in Google Earth, showing dozens of buildings in various stages of planning and design. Courtesy Onuma, Inc.
Birdseye view of a proposed new bank tower in downtown Los Angeles. The massing study was developed in OPS and placed on the site in Google Earth. Courtesy Onuma, Inc.
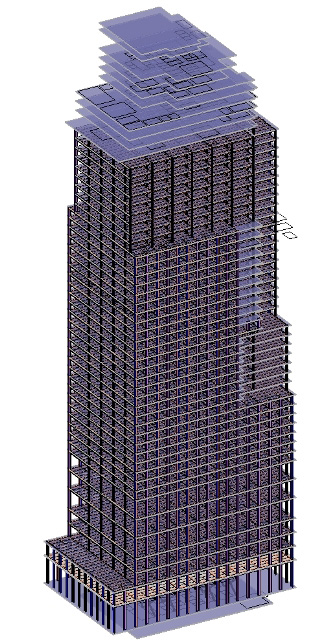
The BIMStorm LAX proposed bank tower undergoing schematic design in Revit Architecture. Design by SSFM International Inc., Honolulu and Manila.
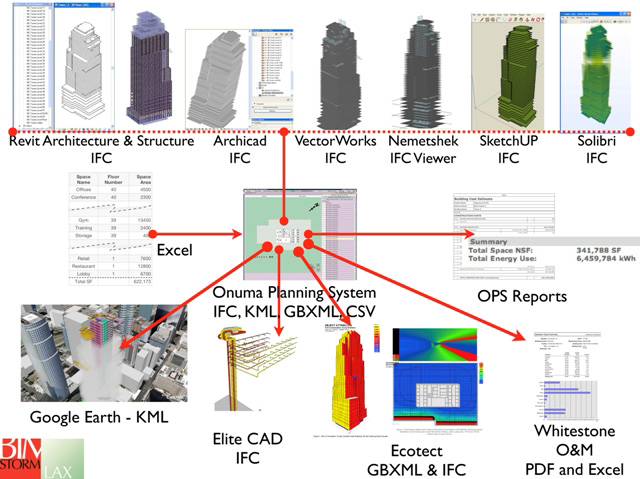
A snapshot of just some of the data formats, open standards, open-source software, and commercial software tools used in BIMStorm LAX: ArchiCAD, CSV, Ecotect, Elite CAD, Excel, gbXML, Google Earth, IFC, KML, Onuma Planning System, PDF, Nemetschek, Revit Structure, SketchUp, Solibri Model Checker, Vectorworks; and Whitestone. Courtesy Onuma.