
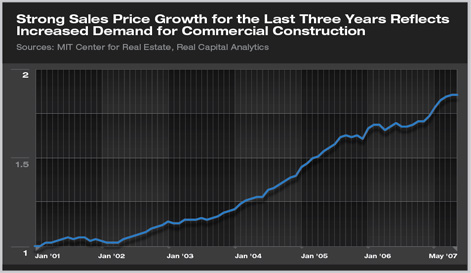
New RCA-based Index Tracks Prices of Commercial Building Transactions by Jennifer Riskus Summary: A new series of indexes developed by MIT that tracks changes in commercial property prices is useful for architects working on commercial projects, or those considering entering this sector. Growth in sale prices of commercial properties has been strong over the last few years as the commercial market boomed, but has now slowed somewhat during the first months of 2007. However, prices are still increasing, meaning that there is still a demand by investors for commercial buildings. In fact, growth is still particularly strong in the office and industrial sectors, a good indication that these building types are currently undersupplied in the market and will continue to be in demand in the future. Developed to assist in the creation of a futures market for commercial property, the Commercial Property Index designed by the MIT Center for Real Estate using data from Real Capital Analytics, Inc. (RCA) provides valuable information for architecture firms. The indexes were created using a repeat sales regression model, which tracks properties that have been sold at least twice, with the most recent transaction occurring in the period for which the data are reported. Essentially, the index is measuring the change in price based on sales information from actual properties. If the index is increasing, then sale prices are increasing, and the opposite is true when the index declines. (For more detailed information on how the index was created, read the white paper “A Set of Indexes for Trading Commercial Real Estate Based on the Real Capital Analytics Transaction Prices Database.” Steady growth since 2001
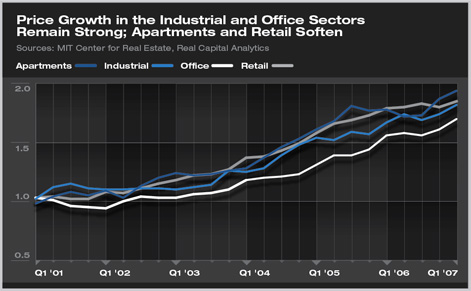
The highest annual growth rate in the index was in 2004, where it grew by over 15 percent; followed by 2005, where the index grew by 14 percent. Growth then slowed to less than 10 percent for 2006, although 2007 is shaping up to be stronger, with 6.5 percent growth through May, compared to 4.8 percent for the same time period of 2006. These trends seem to lead construction spending put-in-place figures from the federal government. Construction spending (including multifamily housing, lodging, office, and commercial) fell in 2001 and 2002 where the national index shows slower growth, then grew by 11 percent in both 2004 and 2005 and by 15 percent in 2006. This supports the notion that rising property values occur when there is an increased demand for commercial space, as evidenced by higher construction spending. Therefore, firms should anticipate fewer inquiries for commercial projects during downturns and slowdowns in the index. Sustained periods of increasing prices, however, indicate an increased interest in the purchase of commercial properties, and should generate more commercial property projects. Building sectors mirror national trends
Data are also available by region of the country, although it is available on a quarterly basis only for the West. Midwest indexes are not available at all, and those for the East and South are only reported annually, making it difficult to use them to assess more than very broad trends. Trends in the West mirror national trends closely, however it is worth noting that retail property sales there declined a bit more sharply in late 2006. But business conditions in the West have been strong overall in the last few years, with their office sales showing a bit less volatility than nationally. Property price increases could mean more work coming For more information on the Commercial Property Index, please visit the website. |
||
Copyright 2007 The American Institute of Architects. All rights reserved. Home Page |
||
news headlines
practice
business
design