ARE
Rates Correlate with Construction, Economic Health, High School
Graduates
by Tracy Ostroff
Summary: Construction
trends and the health of the economy are the factors most likely
to influence the number of candidates for the Architectural Registration
Exam (ARE), an AIA-commissioned study reports. The consultant, Guideline,
studied data provided by the Institute, the National Council of Architectural
Registration Boards (NCARB), state registration boards, and other
environmental records to consider how various demographic, economic,
and social trends have impacted the number of architects seeking
registration in the past 10 years. Researchers found that the 17
states with the highest number of exams taken and passed from 1997–2004
usually were among the states with growth higher than the U.S. average
in several categories. The
study also indicates that changes in numbers
of high school graduates influence and may be indicators for the
number of potential enrollees in architecture programs.
 In its report, An Assessment of Population,
Construction, and Alternative Professions and Their Relationship
to Architect Licensure and Registration Levels, Guideline analyzed AIA-supplied data on the architecture
profession and government, association, and industry sources to compile
statistics on population, school and college enrollment and completion,
labor force, real estate, construction, and professional licenses
and salaries. Researchers compared these data to identify possible
correlations and similar trends, both nationally and at the state
level. The report is particularly useful for parsing registration
and demographic and economic data by state. In its report, An Assessment of Population,
Construction, and Alternative Professions and Their Relationship
to Architect Licensure and Registration Levels, Guideline analyzed AIA-supplied data on the architecture
profession and government, association, and industry sources to compile
statistics on population, school and college enrollment and completion,
labor force, real estate, construction, and professional licenses
and salaries. Researchers compared these data to identify possible
correlations and similar trends, both nationally and at the state
level. The report is particularly useful for parsing registration
and demographic and economic data by state.
 Architect registration and the economy Architect registration and the economy
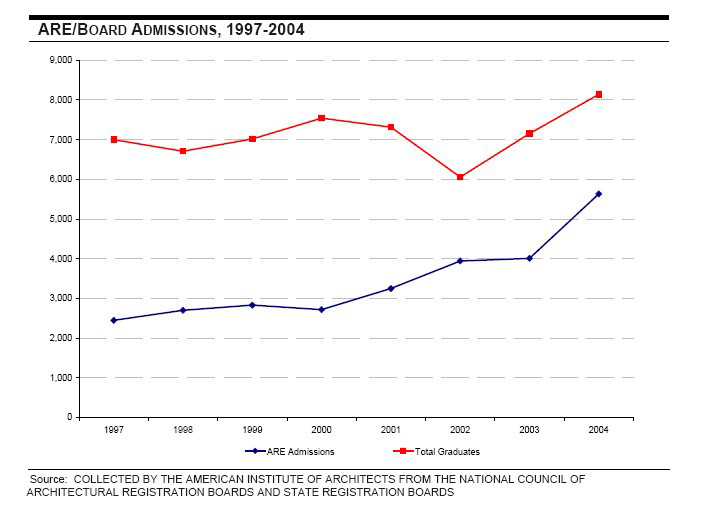
Researchers found that the number of architecture graduates since
the 1983–84 school year peaked in 1992–93 at nearly 8,000. Numbers
then show a steady decline, reaching their lowest levels in 2000–01
and then sharply increased the following two years. In three key
states, California, New York, and Texas, ARE board admissions decreased
from 1999–2002 and then increased sharply in 2004. The declining
number of graduates after 1992–93 may have affected ARE board admissions
in subsequent years. The 13 states leading in architect exams taken
and passed were generally leaders in key demographic calculations,
including population groups, high school graduates, number of people
in the labor force, and construction.
The report also links recent recessionary periods with the profession
of architecture. From 1989–92, the number of architects practicing
in the U.S. decreased from 143,000 to 113,000, according to a Progressive
Architecture report cited in the survey. In addition to the
loss of architect positions, researchers say they assume that many
other entry-level jobs were lost, perhaps influencing both school
enrollment and examinations. On the growth side, Guideline notes
the number of architecture graduates spiked in 1992–93, just as the
U.S. was emerging from recession.
 The
next major change in graduation rates was a drop in 2001–02.
In California, for example, board admissions dropped about 40 percent
from 1999–2001—a decline of about 1,000. As the U.S.
recovered from the dot-com bubble burst of 2000–2002, California’s
board admissions increased as well—116 percent from 2003–2004.
Researchers did not have data prior to 1997 on registrations and
exams, but say that 1997–2000 data are fairly flat, not corresponding
with the boom. They explain this trend by noting that “other
professions were more popular . . . graduates were lured to other
professions promising lucrative rewards.” There is hope, though. “Architects
make up ground on the other professions when it comes to median salaries.” For
all professions, however, there can be wide variations based on size
and type of firm and position within the organization. The
next major change in graduation rates was a drop in 2001–02.
In California, for example, board admissions dropped about 40 percent
from 1999–2001—a decline of about 1,000. As the U.S.
recovered from the dot-com bubble burst of 2000–2002, California’s
board admissions increased as well—116 percent from 2003–2004.
Researchers did not have data prior to 1997 on registrations and
exams, but say that 1997–2000 data are fairly flat, not corresponding
with the boom. They explain this trend by noting that “other
professions were more popular . . . graduates were lured to other
professions promising lucrative rewards.” There is hope, though. “Architects
make up ground on the other professions when it comes to median salaries.” For
all professions, however, there can be wide variations based on size
and type of firm and position within the organization.
Architects versus other professions
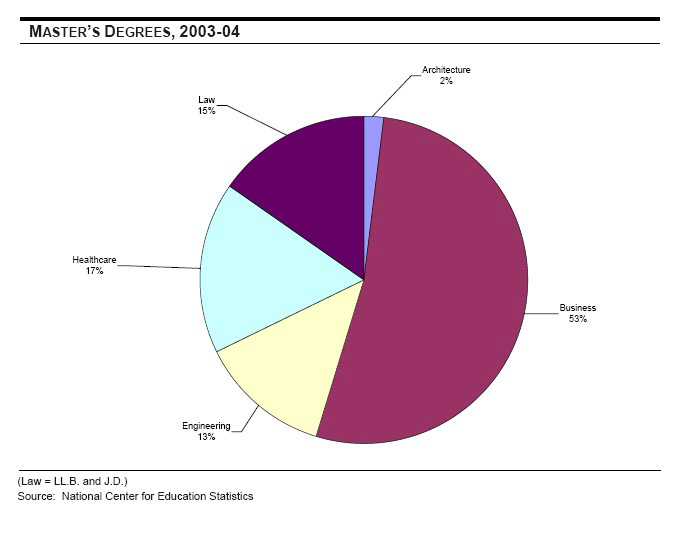
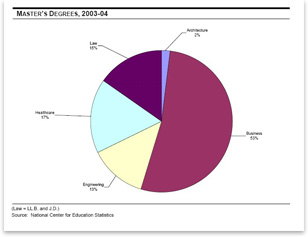
Within the five categories of professional degrees Guideline examined
for context, architecture represented 2 percent of degrees granted.
Business degrees topped the chart at 47 percent, legal degrees
followed at 20 percent, health care placed third with 17 percent,
and engineering represented 14 percent of the population. Of the
four other professional categories Guideline examined, three (except
legal) outpaced architecture’s growth by a magnitude of at
least two or three times. By the 2003-04 school year, business
degrees accounted for an even greater share at 53 percent.
 The study notes that the professions of architecture, law, medicine,
engineering, and business (including accounting) engender various
characteristics and descriptions that suggest explanations of growth.
The researchers define these as being: The study notes that the professions of architecture, law, medicine,
engineering, and business (including accounting) engender various
characteristics and descriptions that suggest explanations of growth.
The researchers define these as being:
- Lucrative: Business (MBAs), doctors, and lawyers are regarded
as highly compensated professionals
- Noble: Doctors in particular and sometimes lawyers are regarded
as “doing good”
- Special/unique: Doctors, lawyers, and accountants are perceived
as having highly specialized skills unique to their field; “although
architects should be perceived this way, too, their roles and responsibilities
overlap other professions (construction management, engineering, real
estate development, interior design, etc.),” the report
notes
- Immediately gratifying: Business (MBA) professionals are not
required to be certified and can immediately join their profession.
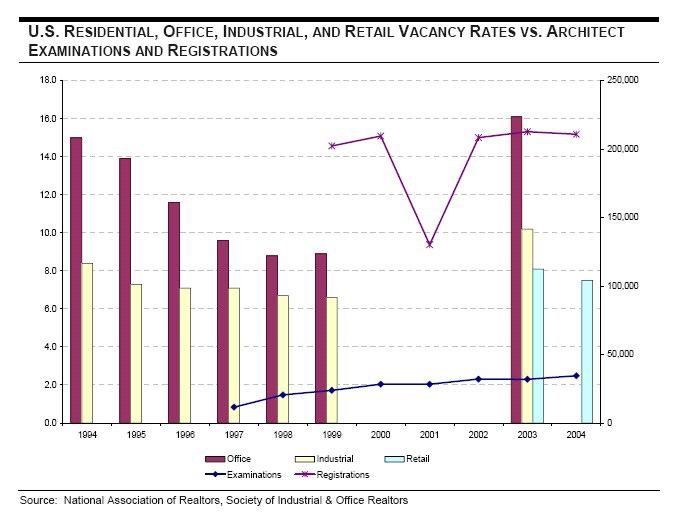
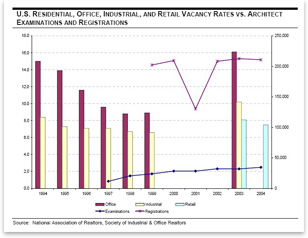
Guideline reports that articles; research by AIA Chief Economist
Kermit Baker, PhD, Hon. AIA; and anecdotal evidence reinforce the
link between architecture employment and billings and construction.
Researchers say, “It’s not unrealistic to assume a trickle-down
effect on architecture registrations and examinations.”
|