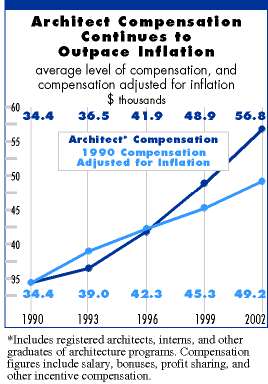
The 2002 survey of U.S. architecture firms just released gives you a comparison of what architecture firms of various sizes are paying 28 categories of professional and administrative staff in specific regions and cities in the U.S. The average compensation increases for architecture positions have outpaced inflation by 15 percent since 1990, which is good for individual architects. Not too surprisingly, compensation at larger firms is typically about 15 percent higher than at smaller firms, which may or may not be good, depending on your perspective.
 Some
comparisons are difficult to make. For instance, the annual compensation
of a principal is more dependent on the firm's performance than less senior
staff because a larger percentage of their compensation is nonguaranteed,
such as bonuses and profit sharing. That is why this compendium of compensation
figures and cross analyses is so valuable.
Here are a few of the findings covered in this survey, which included
1,672 U.S. firms:
• Compensation gains were greatest among senior staff
• Larger firms generally offer higher compensation
• Benefits total about 20 percent of salaries
• Intern compensation saw modest gains since 1999
• Almost half of firms pay more for professional master's degree
holders
• There are financial rewards for becoming registered
• A majority of firms with more than 50 employees offer sign-on bonuses
• Nonguaranteed compensation averages 10 percent for architects and
7 percent for interns
• Compensation for senior principals/partners varies significantly
by firm size
• Benefits vary across regions and total a significant share of salary
• A quarter of firms pay AIA membership dues for interns
• About half of firms provide fees and paid leave for interns taking
the ARE
• The average for paid days off is 25 days.
 Hundreds
of cross tabulations
The 2002 AIA Compensation Report offers compensation tables covering all
nine AIA regions, 34 states, and dozens of metropolitan areas. Firm sizes
fall in eight categories: fewer than 5, 5–9, 10–19, 20–49,
50–99, 100–249, 250 or more, and all firms.
Most of the report's 80 pages are filled with compensation tables for each of the geographic breakdowns. For each region, state, or urban area, the report offers compensation findings for nine categories of architect and architecture intern, six related-professional categories, six headings for other technical staff, and seven listings for nontechnical/administrative staff.
These numbers are further broken down into the mean, lower quartile, median, and upper quartile figure for each job category. The mean is the average compensation for each position. The lower quartile is the point at which 25 percent of the reported compensation values are lower and 75 percent higher. The median is the point where 50 percent of the reported compensation values are higher and half lower. And the upper quartile marks where 75 percent of the reported values are lower than the figure given and 25 percent are higher.
Architect-position categories are senior principal/partner, mid-level principal/partner, junior principal/partner, department head/senior manager, project manager, senior architect/designer, architect/designer III (8–10 years' experience), architect/designer II (6–8 years), architect/designer I (3–5 years), third-year intern, second-year intern, and entry-level intern.
Copyright 2002 The American Institute of Architects. All rights reserved.
![]()
|
To order the 2002 Compensation Report in hard copy or as a downloadable PDF (either for individual regions or the entire country), click here to go to the AIA Bookstore online. |
|