
AIA Chief Economist
For architects as well as other professionals serving the residential construction industry, the past few years have produced unprecedented business opportunities. In spite of the performance of the industry—or more likely because of it—issues have materialized that lead to other concerns about how key segments of our population are affected by housing-related issues. Following is an overview of some key developments in housing and urban development trends from the Joint Center for Housing Study's State of the Nation's Housing 2001.
In the 1990s, housing and jobs continued to migrate to the edges of metropolitan areas where open land is most readily available. Housing demand was especially strong in rural suburbs, where inflation-adjusted median house prices soared 18 percent between 1985 and 1999—well above the rate of appreciation in central cities and urbanized suburbs. The intensity of development in the nation's lowest-density counties has stirred widespread concern about sprawl.
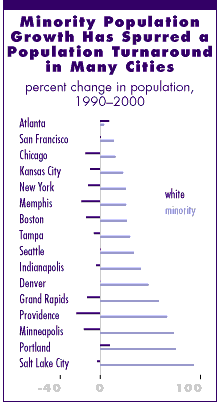
While a true "back-to-the-city" shift did not materialize in the 1990s, many major cities saw their best population growth in more than two decades. Among the 31 central cities of the nation's 50 largest metropolitan areas that lost population in the 1970s, 9 reversed their declines in the 1980s and continued to grow in the 1990s. Another 7 made turnarounds by the end of the 1990s.
 Nevertheless,
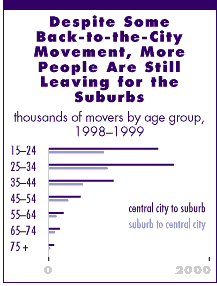
for every three households that moved to central cities in 1999, five
departed. In only a few cases did population growth in cities exceed that
in the suburbs. Moreover, the white populations in nearly all central
cities continued to decline. Were it not for immigration and natural increases
among minorities, almost all cities that made turnarounds over the past
two decades would have instead lost population.
Even among minority movers, though, more left central cities than settled in them during the 1990s. In the next 10 years, increasingly diverse populations will thus contribute to housing demand in cities, suburbs, and non-metropolitan areas throughout the country.
Suburbs continue
to outperform cities
Over the course of the 1990s, both job and housing growth were particularly
strong in lower-density counties within and adjacent to metropolitan areas.
As a result, growth in suburban areas continued to outstrip that in cities
even in most metropolitan areas where city populations increased.
As it has for decades, population growth in the suburbs exceeded that in central cities in most of the nation's metropolitan areas. With few exceptions, the gap between suburban and city growth rates was generally smaller in the South and West where many cities encompass annexed, low-density areas quite distant from the original urban core. Among the exceptions were Oklahoma City; San Antonio; Greensboro, N.C.; and Charlotte.
 Contrary
to reports of a major population shift back to the cities, more households
have been moving out than have been moving in. Notably, among 25 to 34
year-olds-the group perceived to be leading the back-to-the-city movement-twice
as many individuals left cities as moved in. The imbalance is especially
large for those with higher incomes: among movers earning $70,000 or more,
for every one household that headed to the cities, more than three left.
This trend also holds for minorities: more minority movers settled in
the suburbs than in the cities.
Cities have largest
growth in decades
Nevertheless, cities as a group did experience their strongest population
growth in decades. Fully 16 of the 31 cities in the largest metropolitan
areas that lost population in the 1970s or 1980s (or both) gained population
in the 1990s. Among the 16 were some of the nation's largest and oldest
cities, such as New York, Chicago, and Boston. Most of the 15 that continued
to lose population were concentrated in the Northeast and Midwest—including
Hartford, Philadelphia, Pittsburgh, Cleveland, Detroit, and St. Louis.
Although up significantly from cyclical troughs, the central-city share of building permits issued between 1995 and 1999 in the largest metropolitan areas was still modest. Even where central-city population was increasing, growth in the suburbs was so much greater that building permits in the city amounted to only about 15 percent of the metropolitan total.
The building activity that has occurred in many cities has largely served to offset losses in the lower-quality housing stock. There are, however, a few exceptions. Chicago's addition of nearly 20,000 units, for example, signaled both the resumption of population growth after decades of loss and the return of some higher-income households. While such gentrification is often welcomed as a way to improve the mix of urban incomes, it can also displace lower-income residents. Indeed, gentrification has resurfaced as a major concern in many metropolitan areas ranging from Atlanta, New York, and Boston to Chicago and Denver.
Mounting development
pressures
Development has been especially intense in less populated areas of the
country where strong job growth has enabled people to work at ever-greater
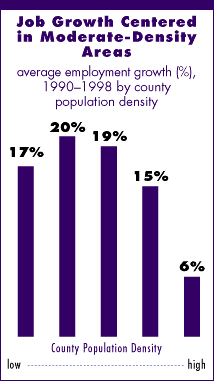
distances from traditional employment centers. Between 1990 and 1998,
average job growth exceeded 15 percent in the nation's low- and moderate-density
counties. In contrast, job gains in the highest-density counties averaged
less than 6 percent
 Soaring
employment in outlying areas has fueled equally strong housing demand.
In response, inflation-adjusted median home prices in rural suburbs climbed
18 percent between 1985 and 1999—well ahead of the 8 percent increase
in urban portions of metropolitan areas. Rural areas outside metropolitan
areas posted the largest increase, with real prices up 21 percent over
the same period.
The vigorous pace of home building has stirred political activism at both the state and local levels to curb growth in outlying areas and closer-in, low-density suburbs. These efforts are intended primarily to preserve open space and to slow or halt further development. As additional growth limitation measures are approved, land costs will rise even more sharply and housing affordability in less-developed areas will continue to erode. These pressures underscore the importance of finding ways to strike a balance between the desire to preserve open space and the need to expand the supply of affordable housing.
The decade ahead
Housing production in the coming decade should rival-if not exceed-1990s
levels. As the oldest of the echo boomers reach young adulthood, they
will drive up demand for apartments and starter homes. The baby boomers,
meanwhile, will be well within their peak earning years, strengthening
demand for second and trade-up homes, as well as for luxury apartments.
These gains at the high end of the market should push the value of residential
fixed investment to new records.
Minorities will have an especially large impact on housing demand. With the ongoing arrival of immigrants and a higher rate of natural increase, the minority share of U.S. households will likely grow from 25 percent in 2000 to about 29 percent by 2010. Indeed, minorities will account for about two-thirds of household growth over the next 10 years. Much of this increase will come from the Hispanic population, which has already grown to a level that rivals that of the black population.
Housing affordability problems may well worsen over the coming decade. Because of their lower average incomes and wealth, many minority households will face special challenges affording higher rents and achieving homeownership.
Copyright 2001 The American Institute of Architects. All rights reserved.
![]()
|
The State of the Nation's Housing 2001 is available from the Joint Center for Housing Studies, either by accessing their Web site, or by ordering a printed copy, 617-495-7908. Figure 1 Notes: Turnaround cities are central cities of the 50
largest MSAs (as of 2000) that lost population in the 1970s and
gained population in the 1980s or 1990s, or both. Figure 2 Source: Census Bureau, Current Population Survey, Migration Table 23. Figure 3 Notes: Each bar represents one-fifth of the US population
as of 1990. The number of counties represented by each bar varies. |
|