
Areas served by manufacturing, technology, and financial services likely to see the smallest employment gains this year

AIA Chief Economist
With a full decade of uninterrupted growth, business conditions have been strong in all regions of the country. As the economy begins to unravel, however, some areas likely will see weaker growth than others. The regions likely to be most affected by the slowdown this year are the Middle Atlantic, East North Central, and East South Central due to the weakness in manufacturing, technology, and financial services.
Fortunately for design firms, construction has been one of the most stable sectors in the economy. Home building continues to report solid numbers, and recent cuts in interest rates will help to offset sagging consumer confidence and rising unemployment rates. However, some dark clouds are beginning to form in certain nonresidential sectors.
A recent report on regional economic conditions from the Federal Reserve Board district banks noted weakness in commercial construction activity in regions served by the Cleveland, Atlanta, St. Louis, and Kansas City district banks. More space has become available for sublet as Internet and high-tech firms have closed or reduced operations. However, commercial vacancy rates were generally reported to be steady, and commercial rents have been steady to rising in most areas.
Resource-based economies
to fare best
The employment outlook for this coming year favors Western regions, with
some solid pockets in the South Central states. The Northeast has performed
very well in recent years but could see the most significant slowing this
year. Problems in the high-tech and financial services areas will hit
hard in this region. Particularly vulnerable are Boston and New York.
![]()
The Midwest, due to its manufacturing orientation, also is likely to be affected by current economic conditions. More consolidation in the auto industry is probable, with Chrysler expected to cut around 200,000 jobs over the next several years.
Economic conditions in the South should exhibit a bit of a split personality this year. High energy prices will help the energy-producing areas of the Southwest: Houston, New Orleans, and parts of Oklahoma. However, the textile and apparel-dependent areas in the Southeast will suffer through a manufacturing slowdown. Weaker consumer confidence levels will dampen consumer spending, which in turn will affect the Florida tourism industry.
As in the South, economic conditions in the West will see considerable variation, although overall prospects are favorable. The Mountain states should pace economic growth nationally, as resource-producing industries and generally affordable housing costs will continue to attract new job seekers. Technology centers in this region-such as Denver and Salt Lake City-may suffer a bit from the technology slowdown.
Economies in the Pacific states should continue to perform reasonably well; a buoyant aerospace industry should help their growth. Energy problems, however, continue to present a risk for Western state economies. The Pacific Northwest has long benefited from low energy costs and therefore could be damaged by higher costs or energy shortages. The California energy crisis, if not resolved shortly, threatens long-term harm to that economy.
Sunbelt metros still
dominate growth
A falling stock market will take its toll on consumer spending, and weak
corporate profits will limit technology investment in the coming year.
Still, some of the key high-tech areas, tourist centers, and retirement
communities will thrive this year. Of the 12 metro areas that Economy.com
projects to have the strongest employment growth this year-each with at
least 2% increases in payroll employment-the majority are in the Sunbelt
and have a strong technology or consumer services economic base:
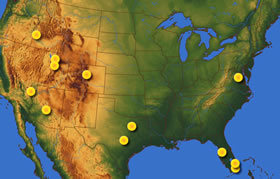 1.
Las Vegas—4.9%
1.
Las Vegas—4.9%
2. Austin, Tex.—3.9%
3. Boulder, Colo.—3.9%
4. Provo, Utah—3.5%
5. Salt Lake City—2.5%
6. Tampa—2.4%
7. Phoenix—2.4%
8. Boise, Idaho—2.4%
9. Dallas—2.3%
10. Fort Lauderdale—2.1%
11. Washington, D.C.—2.0%
12. Palm Beach, Fla.—2.0%.
Copyright 2001 The American Institute of Architects. All rights reserved.
![]()
|
This article is illustrated using a two-faced infographic. Mouse-over the switch bar to see both. |
|